
CRO Lab - Understanding Core Web Vitals to improve your site’s SERP ranking
How your ecommerce site ranks on Google's search results pages is crucial to your online success, but it's not always easy to keep up with the changes that Google implements in terms of what factors affect its ranking. Google are updating their search algorithm and Core Web Vitals are set to become a ranking factor this year so lets examine what they are, how to measure them and how to improve them.
What are Core Web Vitals?
Core Web Vitals are a subset of Google’s Web Vitals aimed at measuring the key facets of the user experience online. They apply to all websites and are featured across relevant Google tools. They represent the most important, measurable performance indicators of a website’s usability and form part of Google's page experience score. They are a great tool for quantifying your site's overall experience and highlighting areas of improvement as those sites that don't meet the defined standards will be flagged as providing a poor UX, and thus penalised in the SERP rankings by Google.
What is measured?
Currently, the key measurements focus on three distinct areas that are defined by Google as critical to all web experiences: Loading Times, Interactivity and Visual Stability.
- Firstly, Cumulative Layout Shift (CLS) measures visual stability. This is calculated by measuring the unexpected shifting of elements on the page whilst it is still downloading. Elements that may shift on downloading include items such as fonts, images, videos, buttons, contact forms and more.
- Secondly, Largest Contentful Paint (LCP) measures loading performance. This is calculated by measuring the time your website takes to show the user the largest content on the screen, in full, and ready for interaction. Google defines the largest content on the screen to be anything above the fold (i.e. before the user needs to start scrolling to see it).
- Thirdly, First Input Delay (FID) measures interactivity. This is calculated by determining the time taken from when a user first interacts with an interactive element on the page (i.e. clicking a link or pressing a button) to the time when the browser responds to your action and starts processing it.
How are they measured?
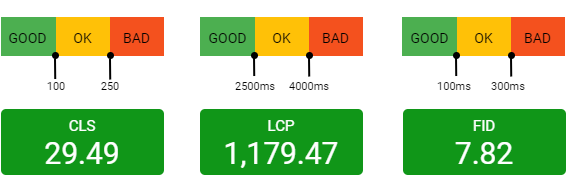
Each of the three metrics is measured against a performance scale with three different thresholds defined by Google, as shown in the image below.
Cumulative Layout Shift (CLS)
CLS is calculated using two metrics/events.
- Impact Fraction which measures how much space an unstable element takes up in the viewport (which is the content you can see on a mobile screen). It is measured by calculating when an element downloads and then shifts, the space that the element occupied, from the location that it occupied in the viewport when it’s first rendered to the final location when the page is rendered.
- Distance Fraction measures the amount of space that the page element has moved from the original position to the final position.
The Cumulative Layout Score is calculated by multiplying the Impact Fraction by the Distance Fraction. A good user experience is defined as having pages with a CLS of 0.1. or less.
However, in order to make things a bit easier to read and process for our customers, we have multiplied CLS scores by 1000 for greater precision. For example, in the image above it now reads 29.49 instead of 0.02949. So a good experience would be defined as having pages with a CLS of 100 or less.
Largest Contentful Paint (LCP)
LCP can be measured in two ways:
- Field mode This is data that is collected within a controlled environment with a predefined device and network settings. This will provide reproducible results to help discover and fix performance issues. Tools like Lighthouse and WebPageTest produce lab data.
- Lab mode This is data that is collected from real page loads your users are experiencing. This data will capture real world user experiences. PageSpeedInsights produces field data.
A good user experience is defined as LCP occurring within 2.5 seconds of when the page first starts loading.
First Input Delay (FID)
FID is a field metric and cannot be simulated in a lab environment so a real user interaction is required in order to measure the response delay. Response are measured in milli-seconds.
A good user experience is defined as having a FID of 100 milliseconds or less.
Tracking Core Web Vitals
When using Web Vitals it can be hard to track improvements as they are measurable in the field, and this field data typically takes 28 days to come through. To help our customers, we have created a dashboard enabling us to analyse the data to see if changes are making positive impacts in less time and also to identify any pages with issues. This is done via Google Tag Manager, Google Analytics & Google Data Studio.
How can they be optimised?
Having analysed your data via the dashboard, we have compiled a range of changes that have a positive impact on all three metrics. Most of the changes are global and affect the scores of every page. We can also target particular pages or core templates to optimise further.
Cumulative Layout Shift (CLS)
- Review core pages (home, product listing, product details, category listing, blog & article) for any layout shift. The main causes of layout shift are images that don't define dimensions using width and height attributes and elements that are moved via JavaScript.
- Set the width and height attributes on all images. This allows the browser to fill out the space needed to avoid any CLS when the images load in. This will restrict the image ratios to what they are currently set to but we will provide updated image size guidelines. If an image is uploaded with a different ratio, it will be clipped using CSS to the predefined ratio.
Largest Contentful Paint (LCP) & First Input Display (FID)
- Review third party scripts as they can have a huge impact on the overall speed of the website. There are a number of third party scripts which can have a huge impact on performance, in particular, live chat, Instagram and YouTube. Reviewing scripts to determine if any can be removed, moved away from the core pages or optimised is a worthwhile exercise.
- Defer images and JavaScript
- Replace mobile menu that is using the mmenu third party script.
- Preload CSS, fonts, logo & sprite. Preloading is a way to let the browser know which resources are important and that they should be fetched sooner. This removes the CSS and fonts from being render blocking resources and reduces the critical requests.
- An image slider/banner is often used as the first component on a website's homepage therefore needs to be as optimised as possible. We can improve the image slider component by adding a loading image, setting height and width to the image, preloading the first image within the carousel and using srcset to only download the image needed for mobile. We can also do the same for the image slider component if that is being used instead of the banner component.
- Optimise all images that are processed through tradeit's administration system resizer with an expected reduction of up to 30%.
- Review any existing JavaScript and optimise where needed or advise of inefficient scripts.
Other Web Vitals
Whilst the Core Web Vitals are seen as the most important metrics for measuring the quality of your site's user experience, there are other vital metrics which supplement them too. These can help examine more of the experience or help to pinpoint specific issues more closely.
For example, Time to First Byte (TTFB) and First Contentful Paint (FCP) are both important elements of the loading experience, so are both useful in diagnosing issues with LCP such as slow server response times or render-blocking resources.
Also, Time to Interactive (TTI) and Total Blocking Time (TBT) are lab metrics that can help diagnose interactivity issues that will impact First Input Delay.